

No lies, just simple truths. Mission: uncover the biggest lie of Power BI.
Why am I Reading This?!
To learn the biggest lie of Power BI
Obviously – what a silly question to ask
To become a kick ass data analyst
fact of life
Make better works of art than Vincent van Gogh
what’s all those sunflowers about anyway
I love my job. I work with Power BI. Ipso facto Power BI = happiness
🙂
Cool Power BI merch
merch merch merch
Sounds like a tool for superheroes
Spiderman – June 2002
let me introduce my best friend, Power BI

What the Frick is Power BI?
It helps you understand things (data) with pretty pictures
In classic Power BI fashion, here’s a picture to help explain.
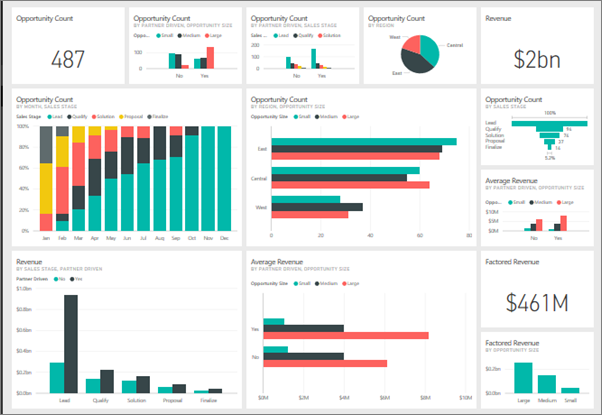
Just like any good storybook, Power BI tells the data story with pictures.
My favourite books are the ones I don’t have to read
Power BI is my happy place.
This is why I love Power BI. That and the Mr Men books, lots of pictures, good times
& the Mr men cakes, they were top notch!
Unfortunately, Power BI doesn’t do cakes but if they did, they’d probably be the best in the world
Carlsberg adverts
Power BI is more than just pretty pictures.
It is an end-to-end solution to all life’s problems
disclaimer: sadly just those that are data related
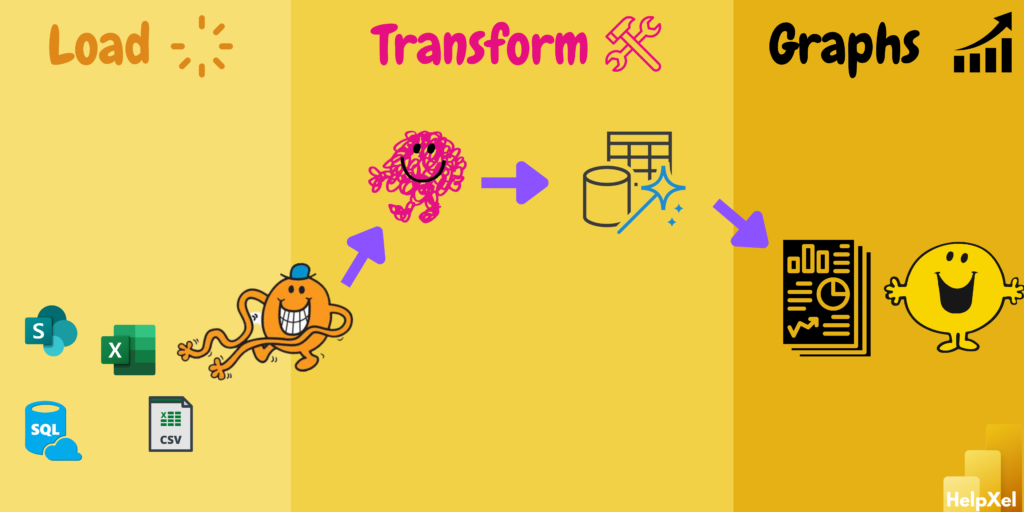
LOAD
Just like Mr Tickles could reach lots of things with his long arms, Power BI has a long reach.
It lets you grab data from far and wide.

TRANSFORM
But oh no the data you loaded into Power BI was prepared by your unhelpful colleague (pictured below)
Luckily Power BI lets you clean up. (Remove unneeded columns, fill in blanks etc)
It does this with a lovely little tool called Power Query
GRAPHS
You now have good clean data.
And you can make reports.
You are now happy.
See image of you below.

Wow, what a tool! Everything I need in one place.
Urrr yeah but it’s a Dashboard…..
People often talk about Power BI dashboards
The dashboard bit just refers to the page as a whole.
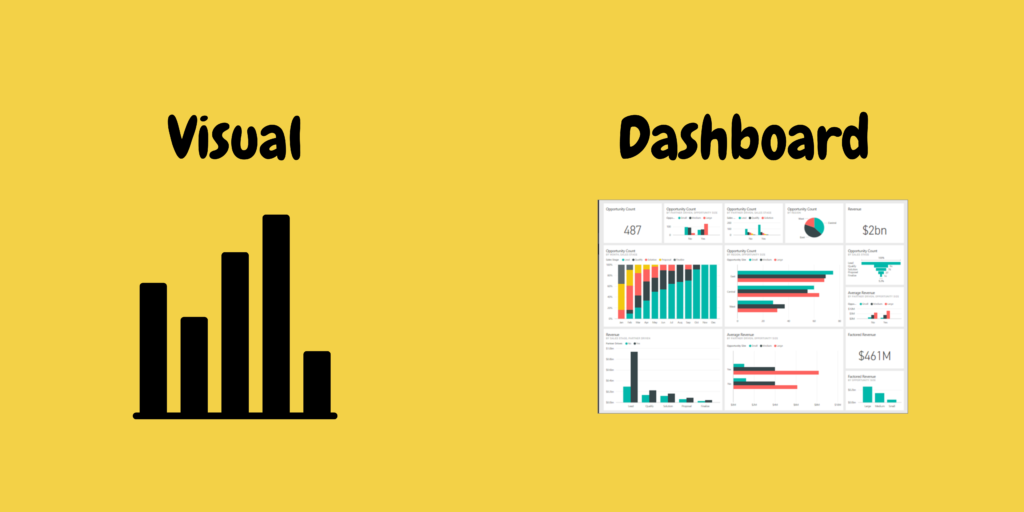
One graph on its own is just a visualisation. Many graphs together maketh a dashboard.
Kingsman – December 2021

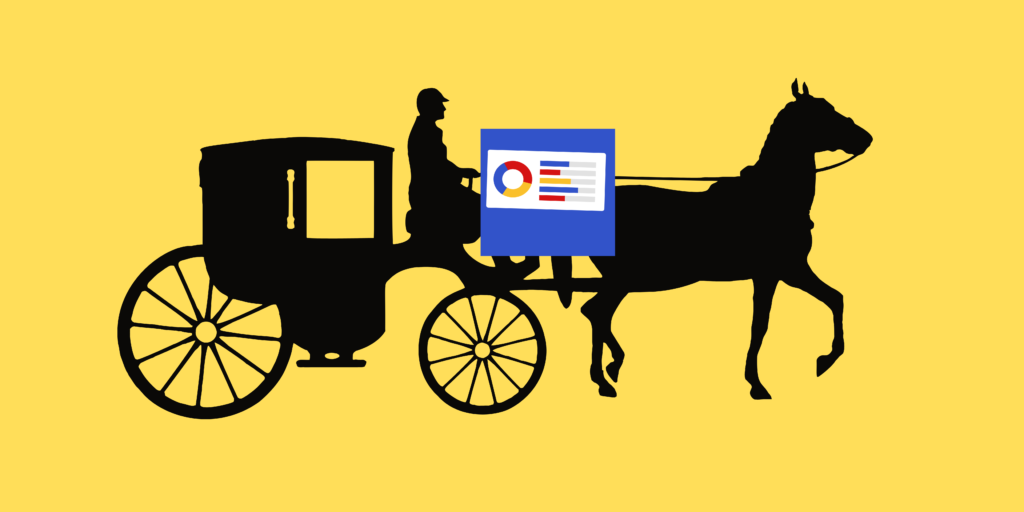
Fun fact (kind of) :
The word dashboard came from a barrier on a horse-drawn carriage between the driver and the horses. It protected the driver from the mud horses would dash up.
Motor Cars replaced horse-drawn carriages. Car is the shortened version of carriage.
Dashboards were the most obvious place to put the metrics about fuel and speed.
Dashboards are now used by companies to track their performance.
And I have now used words to bore you. Win win
THE BIGGEST LIE OF POWER BI
No. 1 LIE:
Power BI is difficult
Power BI is my best bud and it’s dummy proof. Trust me, I know! (see me below)

“five minutes to sign-up; five minutes to WOW!”
Microsoft’s old Power BI tagline
IT REALLY IS THAT EASY!
You can follow the Mr Men process above with your eyes closed (and not end up like Mr Bump).
</> No writing code! </>
</> No need to be a computer wizard! </>

No need to convert to the dark side, wear a Darth Vader mask and breath weird
Code can be confusing, not to mention terrifying.
Power BI lets you click things and create dashboards like a jedi.
Avoid the Uncurious Catastrophe
Don’t stop here! Be curious! Start exploring!
Watch some hilarious Power BI masters (videos = less reading):
Start: Guy in a Cube (Hilariously Helpful)
Middle: How to Power BI (Top Tips)
End: SQLBI (Genuine Genius)
Listen to a podcast
Explicit Measures (less explicit, more measures)
Read awesome Power BI posts
COMING SOON!
Strong Summary
Power BI is awesome
Power BI is easy
Me – December 2022
Power BI turns you into Mr Happy
Me – December 2022
Mr Men books are great
Me – December 2022
So go forth my young padawa and become a Power BI Jedi.
Ps sorry you had to read lots of words

Amazing Analyst Attributes
Excel is the most demanded skill for data analysts jobs.
Here is a great place to get started: Excel Basics