

Welcome to the Space Academy! Are you ready to blast off into the world of data analysis with Power BI measures? Well, strap on your jetpacks and get ready for a journey that’s out of this world. We’re going to go to infinity and beyond with the power of Power BI measures. But don’t worry, this isn’t rocket science (although it might feel like it at first).
We’re going to break it down in simple terms so that even a toy astronaut can understand. So, let’s get started on our mission to analyse data like a pro!
Basic training: Measures 101
Welcome Space Ranger! This is Power BI basic training!
Power BI is a powerful tool for data visualisation and analysis, but it can be overwhelming for those new to the software.
Measures are like laser guns for your data analysis. They allow you to shoot down confusion and uncover hidden insights in the blink of an eye.

Think of them as a part of your basic training as a Space Ranger.
With measures, you’ll be able to calculate things like sum, average, and count with ease.
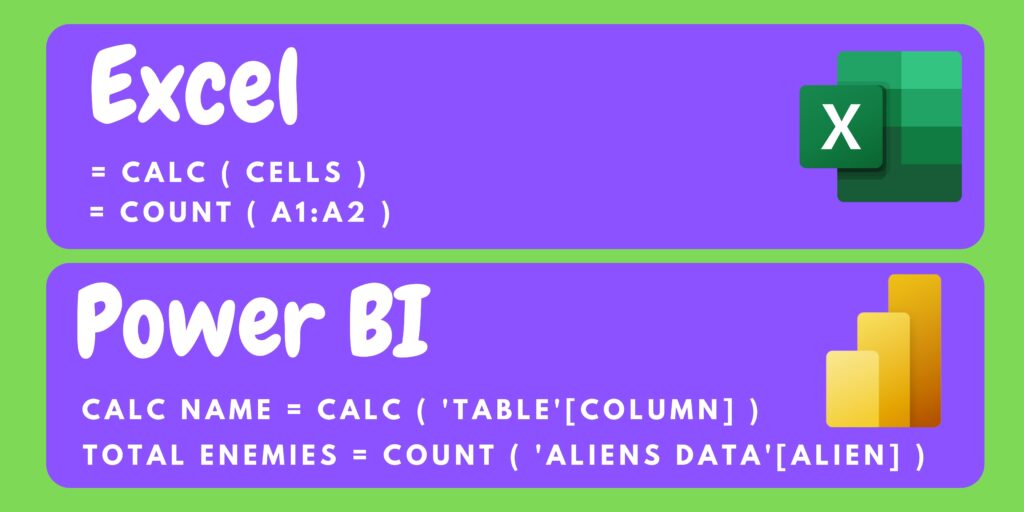
Used Excel? Think of these as formula.
Example 1:
Total Enemies = SUM ( 'Aliens Data'[Alien] )Example 2:
Average Kills = AVERAGE ( 'Aliens Data'[Kills] )Measures are laid out a bit differently to Excel.
Here is how we lay out measures.
You’ll need to display your measures to your fellow cadets. This is how you add it to the Canvas.

Well done space ranger. You’ve made it through basic training. But there is a long way ahead of you yet if you’re going to become an intergalactic hero.
Your first measure mission
Hooyah! Your first mission!
Welcome to mission control. You’re on a mission to explore a new planet.
The expedition team has collected data on the planet’s alien population.
Here is the Power BI file to download. <– LINK!!!
If you need to download Power BI read my article: install it in less than 2 minutes.
We need to find out the aliens strengths to beat them.
You must calculate:
- the average number of eyes per alien, and
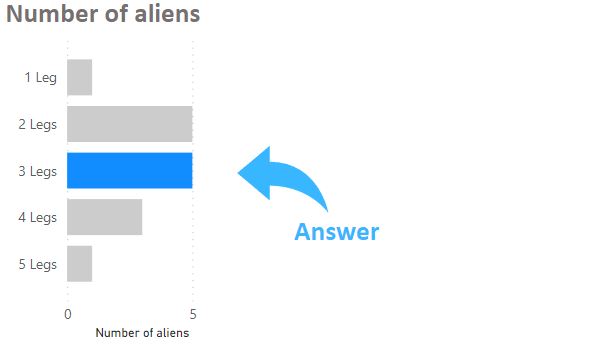
- count how many aliens have three legs
This could be a tricky battle for us!
Use your bacis training space ranger! Don’t make me figure this out for you again!
Are you done yet Space Ranger? Let’s see what you’ve done.

Great job. This is great info!
Let’s try and make first contact (and don’t stare at their extra legs).
For the rest of the class that didn’t keep up with your expert skills here is the answer.
Average number of eyes per alien
Average eyes = AVERAGE ( 'Aliens Data'[Eyes] )count how many aliens have three legs
Number of aliens = COUNT ( 'Aliens Data'[Alien] )We can add these to different types of visuals and split the data in different ways.
Try using a bar chart to make this more clear.
Mission complete!
Mission debrief
In conclusion, measures in Power BI are a must-have weapon in your data battle. They allow you to make sense of your data and uncover insights you never knew existed. So, the next time you’re on a mission and you’re wondering how many legs the aliens have, just remember that Power BI measures can help you out! Now, let’s go save the galaxy!
Intergalactic hero status
So now you know the basics of creating measures in Power BI, but if you really want to achieve Intergalactic Hero status, you’ll need to dive deeper.
That’s where my other article “Evaluation Context: The Key to Power BI” comes in.

It’s like a Jedi training for measures. It will teach you how measures work under the hood and how to use them to their full potential.
Trust me, without this knowledge, you’ll be stuck fighting data with a plastic lightsaber. But with it, you’ll be able to wield the force of data analysis like a true Intergalactic Hero. So go forth, young Space Ranger, and read on to become the ultimate data warrior!